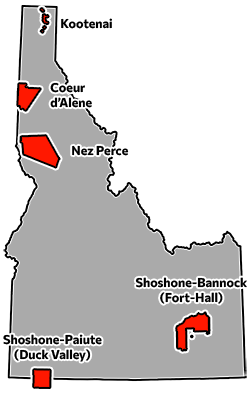
Idaho schools that serve the greatest populations of Native American students (and/or are located on or near reservations) often perform below the state average on tests.
But, as some Native American educators have pointed out, test results may say more about school systems than about students.
Data shows that disparities exist between Native American students and their peers, and between schools that serve comparatively large numbers of Native Americans and those that don’t.
School leaders are working to close those achievement gaps, and many say that means incorporating more Native American perspectives and education into the curriculum, and recruiting more Native American teachers and administrators.
Take a look at the data below to see where Native Americans attend school and how they’re doing academically.
The methodology: A focus on schools serving Native American students/reservations
EdNews recently examined data on how Native American students statewide are doing compared to all students. Here, we look at individual schools’ performance on some of the most common academic achievement measures — the Idaho Reading Indicator, the Idaho Standard Achievement Test, and the SAT.
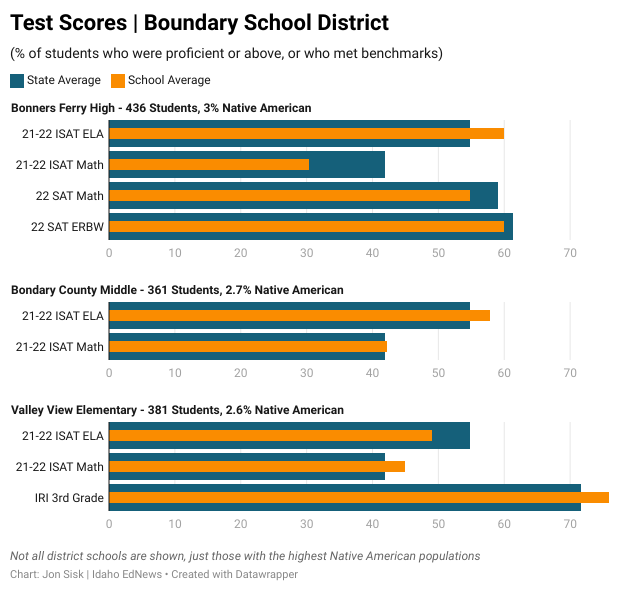
We chose schools that are on or near reservations. In most cases, those were also the schools that serve the most Native Americans (Boundary County schools are one exception; they are near the Kootenai Reservation but serve a relatively small number of Native American students).
The Owyhee Combined School, which is located in Nevada but serves Idaho students and tribes, is included but with different data points since the IRI, ISAT, and SAT are not administered by districts there.
Idaho’s two tribal schools, Shoshone-Bannock Jr./Sr. High and the Coeur d’Alene Tribal School, are not represented because they are federal Bureau of Indian Education schools and assessment data was unavailable.
Native American communities were especially hard-hit by COVID-19 and are still recovering
The testing data included below is from the 2021-2022 school year (the most recent available).
When reviewing the data, it’s worth keeping in mind that many communities are still recovering from the Covid-19 pandemic, which hit Native American communities especially hard. A 2021 Princeton University study found that “Native Americans experience substantially greater rates of COVID-19 mortality compared with other racial and ethnic groups.”
And Idaho tribal communities have confirmed that the pandemic had major impacts on education.
In Fort Hall, a lack of dependable internet access exacerbated remote learning difficulties. The Lapwai School District closed for extended periods of time and followed strict protocols to minimize the spread of illness. The chairman of the Kootenai Tribe of Idaho declined interview requests, citing ongoing, community-wide recovery from the pandemic.
The school-by-school data
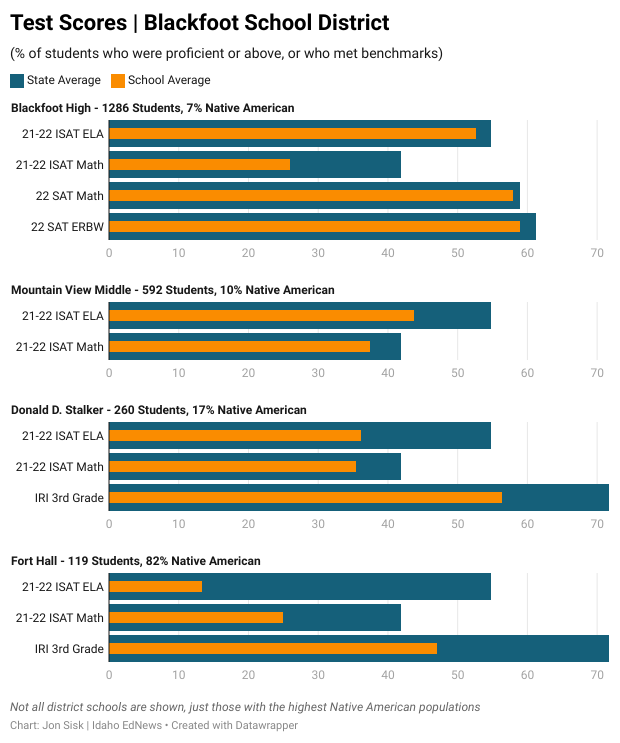
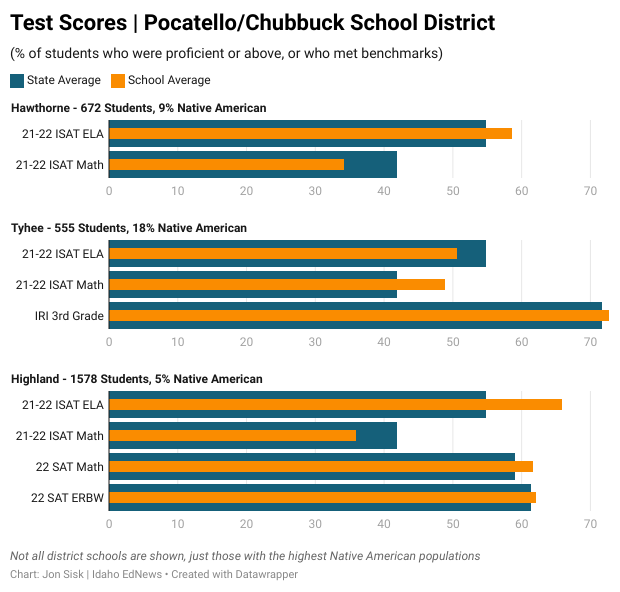
The data below shows school-wide outcomes on some key education achievement measures.
Information about Native American student enrollment at each school and district is also included. However, school districts sometimes report different — and higher — numbers of Native American students than does the State Department of Education.
This could be for a number of reasons.
The SDE relies on students or guardians self-identifying race, and some Native Americans choose not to provide that information for a number of reasons. District numbers can also vary because they pull from state and federal data, while the SDE relies just on state numbers.
DISTRICTS/SCHOOLS ON OR NEAR THE FORT HALL RESERVATION
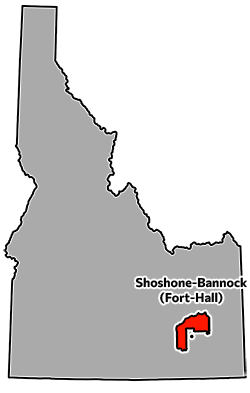
BLACKFOOT SCHOOL DISTRICT
Native American students served, according to the SDE: 394 / 3965 or about 10%
Native American students served, according to the district: About 600-650 / 3965 or about 16%
POCATELLO/CHUBBUCK SCHOOL DISTRICT
Native American students served, according to the SDE: 420 / 12,048 or about 3.5%
Native American students served, according to the district: 846 / 12,348 or about 7%
CHARTER SCHOOLS
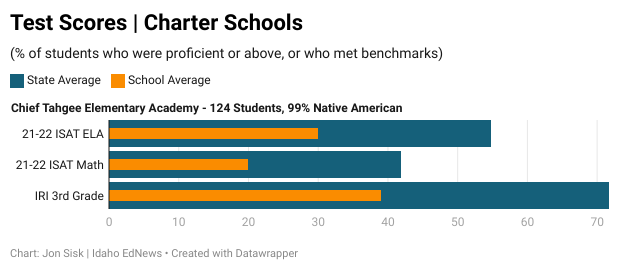
Chief Tahgee Elementary Academy:
Native American students served, according to the SDE: 123 / 124
Native American students served, according to the district: Similar to SDE numbers
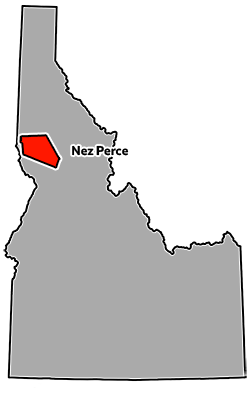
DISTRICTS/SCHOOLS ON OR NEAR THE NEZ PERCE RESERVATION
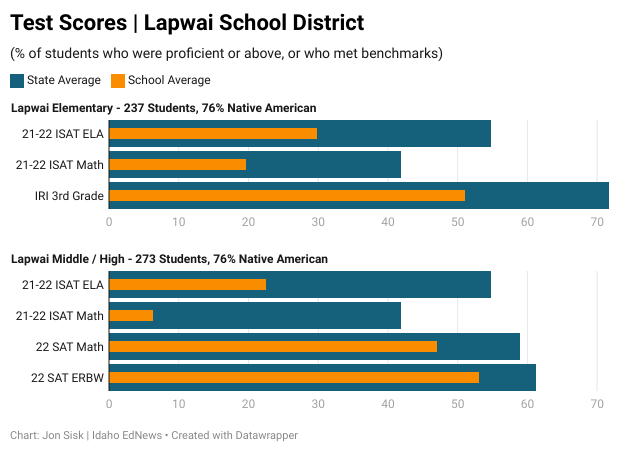
LAPWAI SCHOOL DISTRICT
Native American students served, according to the SDE: 387 / 510 or about 76%
Native American students served, according to the district: 479 / 518 or about 92%
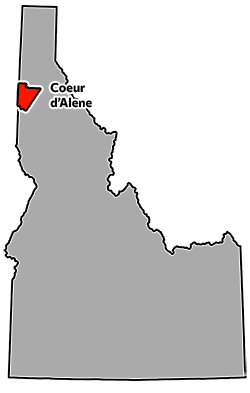
DISTRICTS/SCHOOLS ON OR NEAR THE COEUR D’ALENE RESERVATION
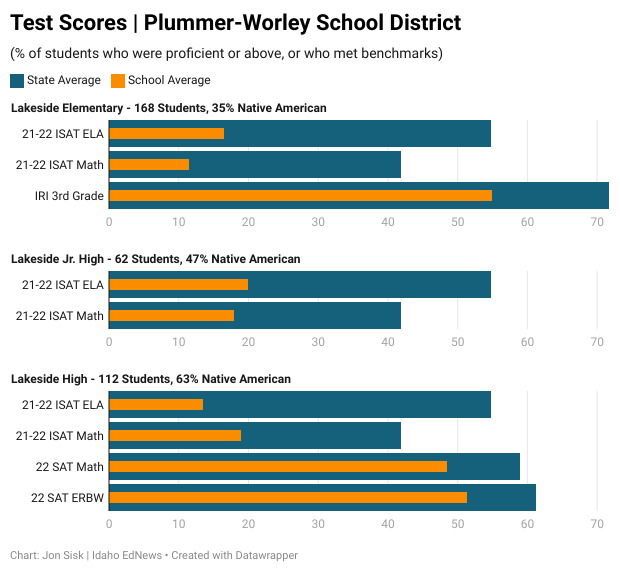
PLUMMER-WORLEY SCHOOL DISTRICT
Native American students served, according to the SDE: 159 / 342 or about 46%
Native American students served, according to the district: Similar to SDE numbers
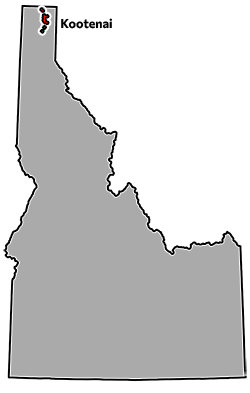
DISTRICTS/SCHOOLS ON OR NEAR THE KOOTENAI RESERVATION
BOUNDARY COUNTY SCHOOL DISTRICT
Native American students served, according to the SDE: 37 / 1,407 or about 2.6%
Native American students served, according to the district: Similar to SDE numbers
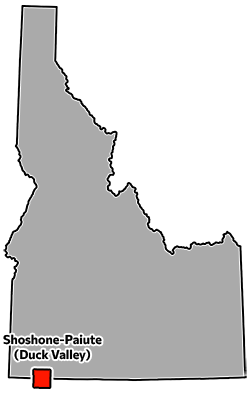
DISTRICTS/SCHOOL ON OR NEAR THE DUCK VALLEY RESERVATION
ELKO COUNTY SCHOOL DISTRICT
Native American students served, according to the Nevada SDE: 567 / 9943 or about 5.7%
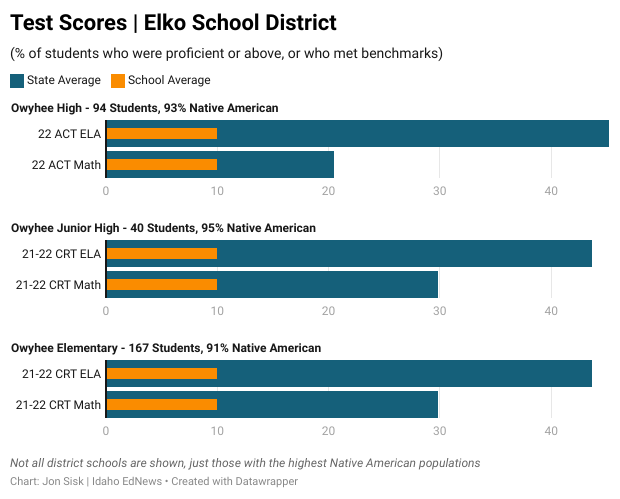
The Owyhee Combined School is located in Nevada and contains three schools within it. The data below reflects some of Nevada’s common learning achievement measures: the ACT and the CRT (which refers to a state-approved, criterion reference test). In both cases, specific results were redacted due to low numbers (10% or fewer) of students who achieved proficiency, which could risk student privacy. However, the redaction threshold indicates that results were below state averages.
This story is part of a series that was made possible with a generous grant from the Education Writers Association.
Idaho Education News data analyst Randy Schrader contributed to this report.

