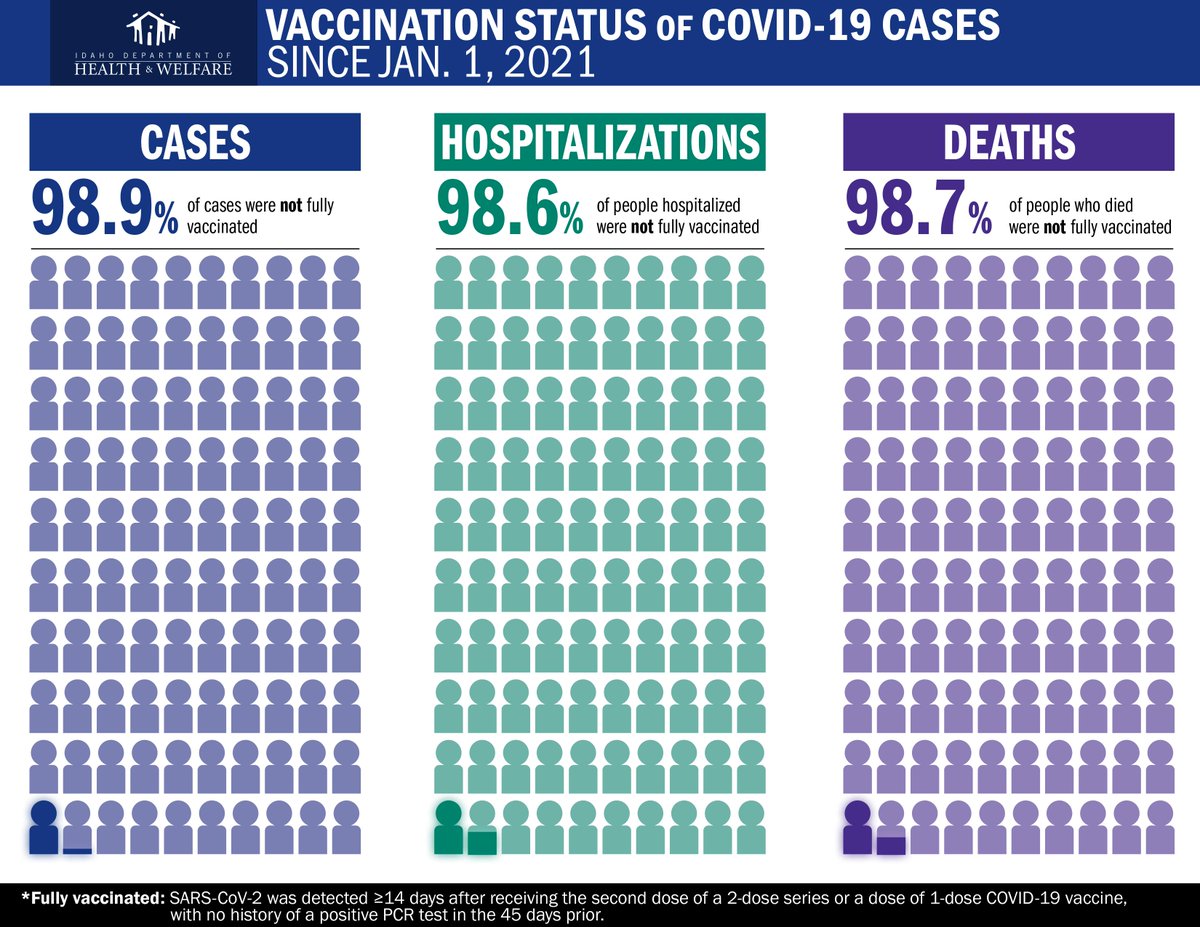
 With coronavirus case numbers spiraling again, health officials and education leaders are renewing their push for Idahoans to get vaccinated.
Department of Health and Welfare Director Dave Jeppesen put it bluntly Tuesday: “This has really become a pandemic for those that are unvaccinated.”
The numbers back that up, as the above Health and Welfare graphic illustrates. The vast majority of coronavirus cases, hospitalizations and COVID-19 deaths involve patients who are not fully vaccinated.
But how does all of this play out on the ground — when you map local vaccination rates against local coronavirus case numbers? That’s where it gets a little more complicated.
Our table at the bottom of this post runs two sets of numbers: the percentage of eligible county residents who are fully vaccinated; and the current, seven-day rolling average of cases per 100,000 residents. Numbers in bold rank in the top 10 statewide.
You would expect the counties with high vaccination rates to have lower infection rates, and vice versa. In some cases, it works that way. Blaine County, which has by far the highest vaccination rate in the state, has an infection rate well below the state average. Idaho County, with the state’s lowest vaccination rate, also has one of the state’s highest infection rates.
But it doesn’t always fit together so neatly.
Four counties with relatively high vaccination rates — Valley, Power, Madison and Twin Falls — also have some of the highest infection rates in the state. And some counties with very low vaccination numbers — such as Boundary, Owyhee and Payette counties — also have low case rates.
For now. It’s a snapshot. And as we’ve seen over the past 16 months, case numbers are volatile, and they can turn on a dime.
So we’ll probably revisit these numbers later, if the delta variant drives up case rates and as the new school year approaches.
| Location | Fully vaccinated | Seven-day average |
| Blaine | 79 | 6.2 |
| Ada | 56 | 10.9 |
| Valley | 55 | 16.3 |
| Teton | 51 | 3.5 |
| Bonneville | 47 | 8.9 |
| Latah | 47 | 6.4 |
| Power | 46 | 18.6 |
| Bannock | 45 | 9.6 |
| Madison | 43 | 12.5 |
| Twin Falls | 42 | 17.3 |
| Lemhi | 41 | 10.7 |
| Custer | 40 | 3.3 |
| Lewis | 40 | 7.4 |
| Benewah | 39 | 3.1 |
| Bingham | 38 | 5.8 |
| Canyon | 38 | 10.4 |
| Fremont | 38 | 4.4 |
| Kootenai | 38 | 12.2 |
| Nez Perce | 38 | 8.5 |
| Adams | 37 | 6.7 |
| Bear Lake | 37 | 18.7 |
| Clark | 37 | 0.0 |
| Bonner | 37 | 6.6 |
| Butte | 37 | 0.0 |
| Jerome | 37 | 5.9 |
| Shoshone | 37 | 35.5 |
| Oneida | 36 | 15.8 |
| Camas | 35 | 12.9 |
| Gooding | 35 | 2.8 |
| Jefferson | 35 | 9.1 |
| Lincoln | 35 | 2.7 |
| Gem | 34 | 9.5 |
| Washington | 34 | 2.8 |
| Caribou | 33 | 2.0 |
| Clearwater | 33 | 4.9 |
| Minidoka | 33 | 11.5 |
| Cassia | 31 | 8.3 |
| Franklin | 31 | 4.1 |
| Boundary | 30 | 3.5 |
| Elmore | 30 | 8.8 |
| Payette | 28 | 3.6 |
| Boise | 27 | 9.1 |
| Owyhee | 27 | 2.4 |
| Idaho | 26 | 15.4 |
| STATEWIDE | 45 | 10.1 |
