We crunched a lot of numbers to examine the effects of House Bill 1 — the tax overhaul that passed the Legislature 10 years ago this week.
 Now, here’s your chance to join in the fun.
Thanks to our IT guru, Jonathan Sisk, we have a series of searchable tables that you can use to see what happened in your neighborhood.
So let’s get started.
Property taxes, then and now
For this table, we looked at school property tax levies in 2005-06 and 2015-16.
One big difference, reflected in the numbers: House Bill 1 eliminated $260 million in maintenance and operations school levies. The property tax relief came from slashing this M&O levy.
Another big difference: 94 of Idaho’s 115 school districts collected supplemental property tax levies in 2015-16. Before House Bill 1 came along, that number was 59.
You might actually see a property tax increase in your district. That isn’t a misprint, and it occurred in 26 districts. Most likely, it means that you and your neighbors approved a supplemental levy that’s bigger than the M&O levy that was in place a decade ago.
(By the way, our numbers do not include voter-approved plant facilities levies for schools, or building bond issues. Property taxes cover plant facilities levies and bond issues. But House Bill 1 didn’t address the facilities end of school taxes, so we’ve kept those numbers out of the equation.)
Market values, then and now
Want to know what’s happened to your district and its tax base? This table has the answers.
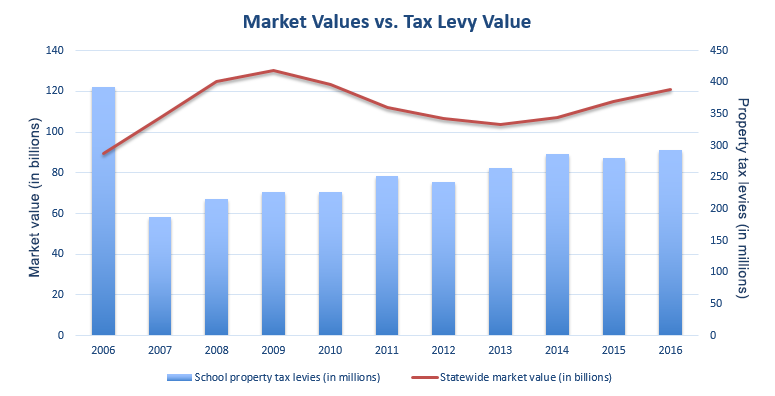
Chances are, market values in your district are up from 2005-06. Of course, this has not been a linear increase. Think Great Recession: Between 2008-09 and 2012-13, market values tumbled across the state to the tune of $26.3 billion (yes, billion with a “b”). Market values are bouncing back, but they haven’t yet hit the 2008-09 high-water mark.
Rising market values are generally good news for property taxpayers. As these values go up, a school district or a local taxing entity can collect its levy from a wider tax base.
Here’s a look at the statewide tax and market value trends over the past decade.
School tax rates, then and now
OK, now let’s mash our two tables together.
It’s simple division. We’re taking the school levies from the first table and dividing them against the market values. That will tell you how much you paid in school tax levies, based on $100,000 of market value.
Odds are, you are paying a lower property tax rate for school levies than you did before House Bill 1 went on the books. But there are exceptions. The rates are actually higher in four districts: Aberdeen, Blaine County, Kendrick and Ririe.
The bottom line
The conclusion from these tables: House Bill 1 did cut property taxes across the state. The increase in supplemental levies put a big dent in the tax cuts of 2006, but overall, property tax levies are still lower.
But the property tax cut has to be considered against the increase in the sales tax. House Bill 1 added a penny to the sales tax rate, and that brought in $217 million in 2015-16. Tally it all up, and the tax shift of 2006 really pencils out to a tax increase.
This series at a glance
Tuesday: Why we took a deeper dive into the tax shift
Wednesday: Tax shift of 2006 adds up to a tax increase
Wednesday: What the 2006 overhaul did to taxes in your district

