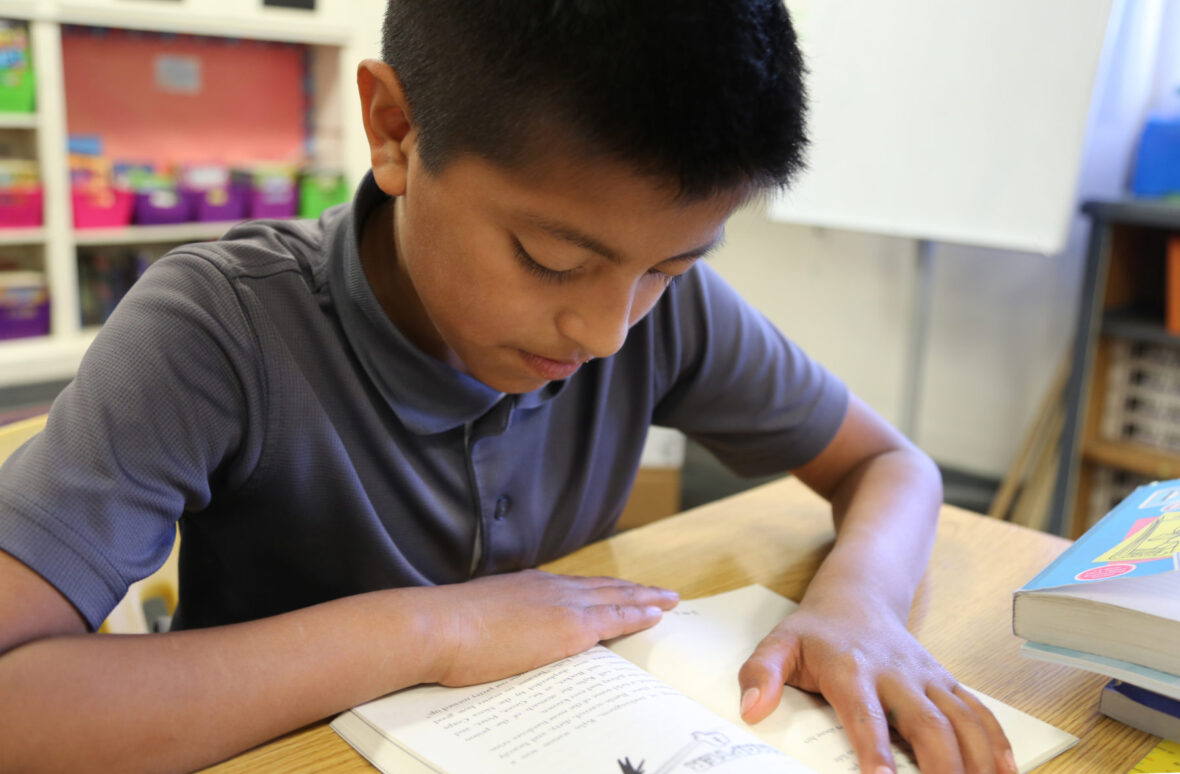
Just over 65% of Idaho’s kindergartners through third-graders read at grade level this spring, according to Idaho Reading Indicator results released by the State Department of Education Monday.
While spring reading scores are up from fall scores, they’re not as high as spring reading scores in years past. In the spring of 2019 (the last spring IRI before the COVID-19 pandemic), almost 70% of students read at grade level.
This year, some 30,000 of Idaho’s youngest students were not reading at grade level.
Students also accomplished slightly less growth during the school year than they did before the pandemic. From the fall of 2018 to the spring of 2019, student reading proficiency improved by about 17 percentage points. This year, while many students navigated hybrid learning or quarantine-forced closures, the fall-to-spring increase was about 15.5 percentage points.
“The percentage of students reading at grade level was lower this spring than it was in spring 2019, but this is a different cohort of students, facing unprecedented challenges during a pandemic that stretched on for more than a year,” SDE director of Assessment and Accountability Kevin Whitman said in a news release.
About 70% of all third-graders tested at or above grade level this spring. Third-grade reading comprehension is considered a critical mile marker in a student’s education because it’s the last grade students learn to read, instead of read to learn. Again, this year’s number lags slightly behind pre-pandemic levels. In the spring of 2019, 73.5% of third-graders were reading at grade level.
Gov. Brad Little and the State Board of Education have made boosting early literacy one of Idaho’s key goals, channeling millions into literacy funding. The State Board has pledged to the federal government that it will emphasize addressing kindergarten through fourth-grade reading gaps with federal COVID relief dollars.
Achievement gaps between demographic groups remain significant. However, improvements from fall to spring show that some traditionally underserved student groups outpaced average growth, closing achievement gaps slightly.
Students with disabilities marked a stark exception. Just 30 percent of students with disabilities were considered at grade-level this spring, up only 8 percentage points from the fall.
Here’s the breakdown, among different student groups:
| Population | At grade level, fall 2020 | At grade level, spring 2021 | Change, fall to spring | Did growth outpace the average? |
| All students | 49.6 | 65.1 | 15.5 | |
| American Indian or Alaskan Native | 26.1 | 43.6 | 17.5 | ↑↑↑ |
| Asian or Pacific Islander | 66.1 | 75.3 | 9.2 | |
| Black / African American | 32.4 | 47.1 | 14.7 | |
| Native Hawaiian / Pacific Islander | 47.5 | 65.7 | 18.2 | ↑↑↑ |
| White | 53.9 | 69.3 | 15.4 | |
| Hispanic or Latino | 33.3 | 49.6 | 16.3 | ↑↑↑ |
| Two or more races | 53.6 | 68 | 14.4 | |
| Economically disadvantaged | 36.5 | 54 | 17.5 | ↑↑↑ |
| Students with disabilities | 22 | 30.6 | 8.6 | |
| Male | 48.1 | 63.6 | 15.5 | |
| Female | 51.1 | 66.6 | 15.5 | |
| Migrant | 17.8 | 33.8 | 16 | ↑↑↑ |
| Homeless | 25.9 | 43.4 | 17.5 | ↑↑↑ |
| Limited English Proficient | 21.4 | 36.8 | 15.4 | |
| Foster | 23.9 | 42.1 | 18.2 | ↑↑↑ |
| Military connected | 52.1 | 71.1 | 19 | ↑↑↑ |
In all, 87,538 K-3 students took the IRI this spring.
Check back with EdNews later this week for reaction from state officials and a more in-depth breakdown of this year’s scores.
